How to Read Stock Charts: A Complete Guide for Beginners
Jeffery ObiagwuShare
Why Chart Reading Matters
Stock charts are visual tools that show a stock’s price history over time. They help traders and investors analyze past movements to make informed decisions about buying or selling. Whether you’re a long-term investor or short-term trader, learning to read charts is essential.
Who Uses Stock Charts
- Day Traders: For quick decisions.
- Swing Traders: To spot short-term trends.
- Investors: To find the best entry/exit points for long-term holdings.
Types of Stock Charts
Line Chart
Simplest form, connecting closing prices with a line. Great for long-term trends but lacks detail.
Bar Chart
Displays opening, closing, high, and low prices. Offers more insight than a line chart.
Candlestick Chart
Most popular type. Each “candle” shows the open, close, high, and low within a time period. Color indicates price direction—green for up, red for down.
Basic Elements of a Stock Chart
- Price Axis (Y-Axis): Shows price levels.
- Time Axis (X-Axis): Shows time period (days, weeks, etc.).
- Volume: Number of shares traded, often shown as bars at the bottom.
- OHLC: Open, High, Low, Close—key data shown in candlesticks.
Understanding Candlestick Patterns
Bullish vs. Bearish Candles
- Bullish: Close is higher than open (usually green).
- Bearish: Close is lower than open (usually red).
Reversal and Continuation Patterns
- Doji, Hammer, Engulfing: Signal reversals.
- Three White Soldiers, Flags: Signal continuation.
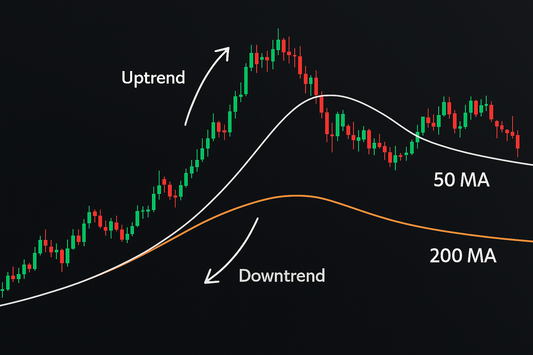
How to Read Trends on a Chart
- Uptrend: Series of higher highs and higher lows.
- Downtrend: Series of lower highs and lower lows.
- Range-bound: Sideways movement between support and resistance.
Drawing Trendlines
Connect at least two lows (uptrend) or highs (downtrend) to create visual guides for trend direction.
Using Moving Averages
- SMA (Simple Moving Average): Average of closing prices over a period.
- EMA (Exponential Moving Average): Gives more weight to recent prices.
These lines help identify trend direction and act as support/resistance.
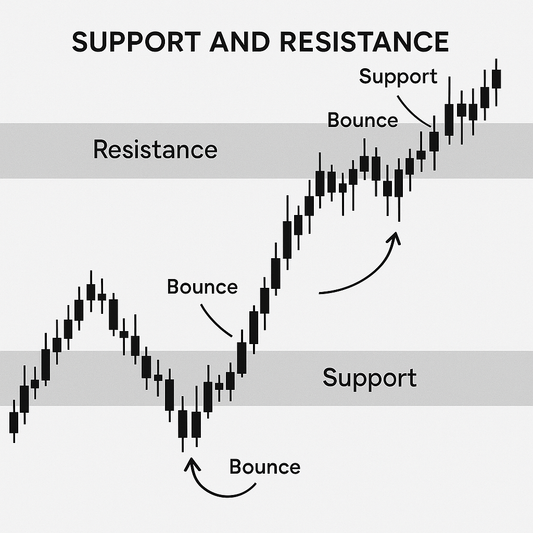
Support and Resistance Levels
- Support: Price level where buyers step in.
- Resistance: Price level where sellers emerge.
These horizontal lines help traders decide where to buy or sell.
Chart Indicators for Beginners
- RSI: Measures momentum. Above 70 = overbought, below 30 = oversold.
- MACD: Shows trend changes and momentum.
- Bollinger Bands: Identify volatility and possible breakout zones.
Volume Analysis on Stock Charts
- Volume Spikes: Can confirm breakouts or reversals.
- Low Volume: Often signals indecision or lack of strength behind moves.
Use volume in combination with price action to strengthen your analysis.
Time Frames and Chart Analysis
- Intraday: For day traders (1-min to 15-min charts).
- Daily: Best for beginners and swing traders.
- Weekly: For long-term investors.
Choose the timeframe that matches your trading style.
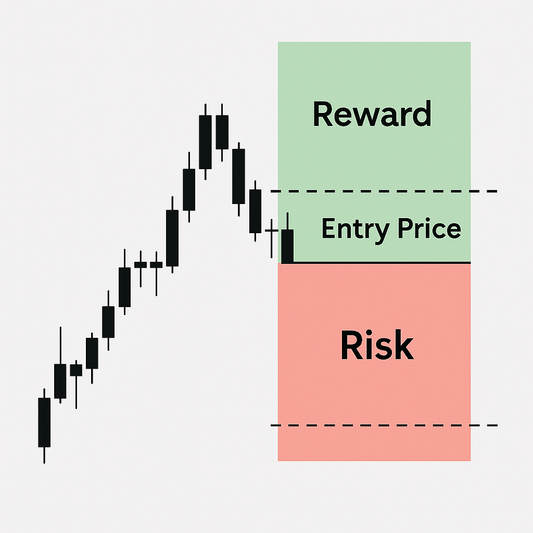
How to Use Charts for Entry and Exit
- Entry: Look for pullbacks to support or trendlines.
- Exit: Use resistance levels or set targets using previous highs/lows.
Combine with indicators for better timing.
Common Chart Reading Mistakes
- Ignoring volume or timeframes.
- Assuming patterns are foolproof.
- Using too many indicators (analysis paralysis).
Keep it simple and focus on key elements first.
Best Tools to Read Stock Charts
- TradingView: Browser-based, customizable, community scripts.
- Thinkorswim: Advanced charting and indicators.
- Finviz: Basic charts with built-in screeners.
FAQs on Reading Stock Charts
1. What’s the best chart type for beginners?
Candlestick charts—visually rich and widely used.
2. Can I trade with charts alone?
Yes, but combining with fundamentals strengthens decisions.
3. Do patterns always work?
No, they increase probabilities—not guarantees.
Conclusion and Next Steps
Reading stock charts doesn’t have to be overwhelming. Start by understanding the basics—price, volume, trends—and gradually build your skills with indicators and pattern recognition. Practice daily with paper trading and chart analysis to develop confidence and consistency.