Technical Analysis for Beginners: Understanding Patterns, Indicators, and Trends
Jeffery ObiagwuShare
What is Technical Analysis?
Definition and Core Concept
Technical analysis is the study of historical price data—primarily through charts—to forecast future market behavior. It assumes that all market information is reflected in the price, making charts the primary tool for decision-making.
Price Discounts Everything
This foundational principle suggests that all known information (news, fundamentals, sentiment) is already factored into the price. Therefore, by analyzing price patterns, traders can anticipate what might happen next.
Why Use Technical Analysis?
- Forecasting Market Moves: Identify potential reversals or continuations.
- Timing Entries and Exits: Helps decide when to enter or leave trades based on pattern setups or indicator signals.
Types of Technical Charts
- Line Charts: Simple, clean view of closing prices.
- Bar Charts: Show open, high, low, and close (OHLC) for each period.
- Candlestick Charts: The most popular format, visually showing market sentiment through candle shapes and colors.
Key Components of Technical Charts
- Price: Displayed on the vertical axis.
- Time: Displayed on the horizontal axis.
- Volume: Often at the bottom of the chart; shows trading activity.
- OHLC: Each data point in candlestick and bar charts includes these values.
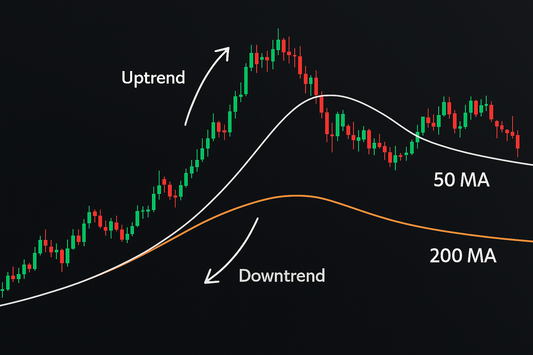
Understanding Market Trends
Uptrend, Downtrend, Sideways
- Uptrend: Higher highs and higher lows.
- Downtrend: Lower highs and lower lows.
- Sideways: Range-bound movement between horizontal support and resistance.
How to Identify and Confirm Trends
Use trendlines, moving averages, or higher timeframe confirmations to validate trends.
Common Chart Patterns Explained
- Head and Shoulders: Signals potential reversal.
- Double Top/Bottom: Indicates strong support or resistance reversal.
- Triangles: Symmetrical, ascending, or descending patterns that suggest continuation.
- Flags and Pennants: Short-term continuation patterns following strong price moves.
Candlestick Patterns Every Trader Should Know
- Doji: Signals indecision or potential reversal.
- Hammer: Bullish reversal at the bottom of a downtrend.
- Engulfing: A strong signal of reversal when one candle “engulfs” the previous one.
- Shooting Star: Bearish reversal at the top of an uptrend.
Top Technical Indicators
- Moving Averages: Smooth out price action; SMA and EMA are most common.
- RSI (Relative Strength Index): Momentum oscillator; overbought above 70, oversold below 30.
- MACD: Combines momentum and trend-following; useful for spotting divergence and crossovers.
- Bollinger Bands: Measure volatility; prices touching bands may indicate overbought/oversold conditions.
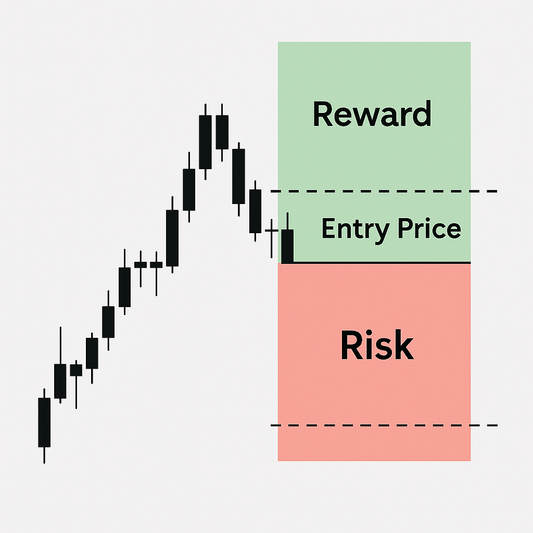
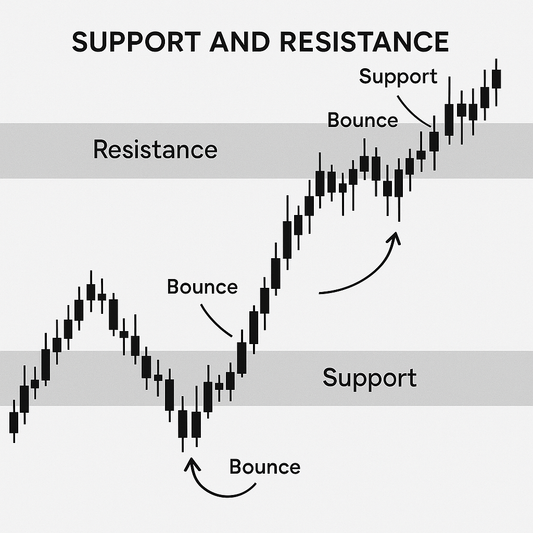
Support and Resistance Levels
- Support: Price level where demand increases.
- Resistance: Price level where supply increases.
- Drawn by connecting historical highs/lows or using psychological price points.
Volume Analysis in Technical Trading
- Volume Confirms Price Moves: High volume means strong conviction.
- Volume Spikes: Often signal breakouts or climaxes in price.
Timeframes and Chart Settings
- Intraday (1-min to 15-min): For day traders.
- Daily/4-Hour: For swing traders.
- Weekly/Monthly: For long-term investors.
Choose based on your trading style and availability.
Backtesting with Technical Tools
- Why It Matters: Helps verify that your strategy works over time.
- Tools: Use TradingView, MetaTrader, or backtesting platforms with built-in simulators.
Combining Technical Indicators for Strategy Building
- Use complementary tools (e.g., RSI + Moving Average).
- Avoid indicator overload—stick to 2–3 per chart for clarity.
Common Mistakes Beginners Make in Technical Analysis
- Overcomplicating Charts: Keep it simple—more indicators doesn’t mean better results.
- Relying on One Indicator: Combine price action, patterns, and volume.
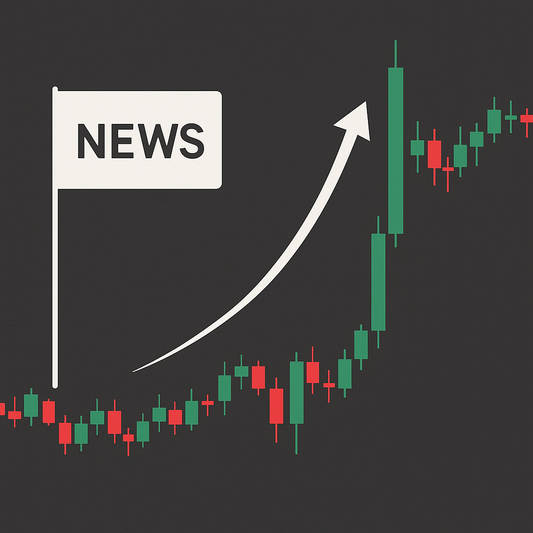
- Ignoring Market Context: Always consider news, overall market sentiment, and volume.
FAQs on Technical Analysis
1. Can technical analysis predict the market?
It identifies probabilities, not certainties. It’s a tool—not a crystal ball.
2. What’s better—technical or fundamental analysis?
Depends on your goals. Traders prefer technicals; investors often combine both.
3. Is technical analysis outdated?
No. It’s still widely used, especially when combined with data and psychology.
Conclusion and Getting Started
Technical analysis is an essential skill for every trader. Start by learning to recognize trends, support/resistance, and simple patterns. Practice by reading charts daily, backtesting strategies, and combining indicators wisely.
Master one concept at a time, and soon you’ll be analyzing charts with confidence and clarity.