Understanding Candlestick Patterns: A Visual Guide for Beginners
Jeffery ObiagwuShare
Introduction to Candlestick Charts
What Are Candlestick Charts?
Candlestick charts are a graphical representation of price movements in financial markets. Each candlestick shows the price action for a specific time period and provides insights into market sentiment.
History and Importance
Originating from Japanese rice traders in the 1700s, candlestick patterns remain a vital tool in modern trading. They help visualize the battle between buyers and sellers, making it easier to predict future moves.
Anatomy of a Candlestick
Body, Wick, and Shadow
-
Body: Represents the opening and closing price.
-
Wicks (or Shadows): Represent the highest and lowest prices during that time.
-
Color: Typically green (or white) for bullish candles, red (or black) for bearish candles.
Bullish vs. Bearish Candles
-
Bullish Candle: Close is higher than open.
-
Bearish Candle: Close is lower than open.
Understanding these basics is crucial before diving into patterns.
Timeframes and Candlestick Interpretation
How Candles Differ by Timeframe
A 1-minute candlestick might show quick momentum, while a daily candle reflects more meaningful trend behavior.
Choosing the Right Chart
New traders should start with daily or 4-hour charts for clearer patterns and stronger signals.
Single Candlestick Patterns
Doji
-
Indicates indecision.
-
Appears when open and close are nearly equal.
Hammer
-
Found at bottoms.
-
Signals potential bullish reversal.
Shooting Star
-
Found at tops.
-
Signals potential bearish reversal.
Spinning Top
-
Indicates market indecision and potential pause in trend.
Bullish Candlestick Patterns
Bullish Engulfing
-
Large green candle swallows previous red one.
-
Sign of strong buying pressure.
Morning Star
-
Three-candle pattern indicating a bullish reversal after a downtrend.
Piercing Line
-
Green candle closes above the midpoint of previous red candle.
Bearish Candlestick Patterns
Bearish Engulfing
-
Large red candle consumes previous green one.
-
Indicates sellers taking control.
Evening Star
-
Three-candle pattern signaling a bearish reversal after an uptrend.
Dark Cloud Cover
-
Red candle opens above previous green and closes below its midpoint.
Multi-Candle Formations
Harami
-
Smaller candle inside the previous one.
-
Can signal reversal or pause.
Three White Soldiers
-
Three consecutive strong green candles.
-
Bullish continuation pattern.
Three Black Crows
-
Three red candles showing strong selling pressure.
-
Bearish continuation pattern.
How to Confirm Patterns Before Entering Trades
-
Volume Confirmation: Look for increased volume on breakout or reversal.
-
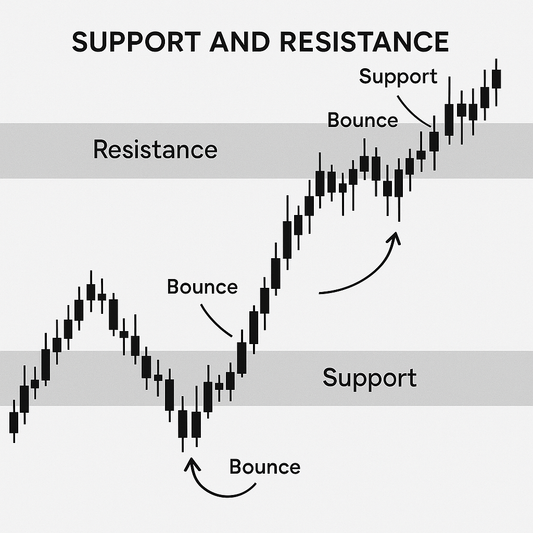
Support/Resistance Zones: Validate patterns near key levels.
-
Trend Context: Patterns are stronger in established trends.
Common Mistakes in Reading Candlesticks
-
Ignoring Context: Patterns alone aren't enough.
-
Overtrading on Patterns Alone: Use confirmation methods.
-
Misreading Reversals: Not all patterns lead to major reversals.
Using Candlestick Patterns in Strategies
-
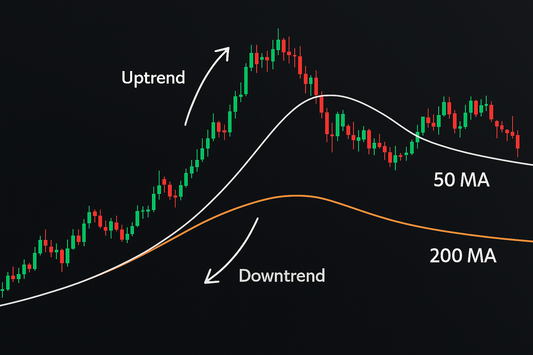
Combine with indicators like RSI or MACD.
-
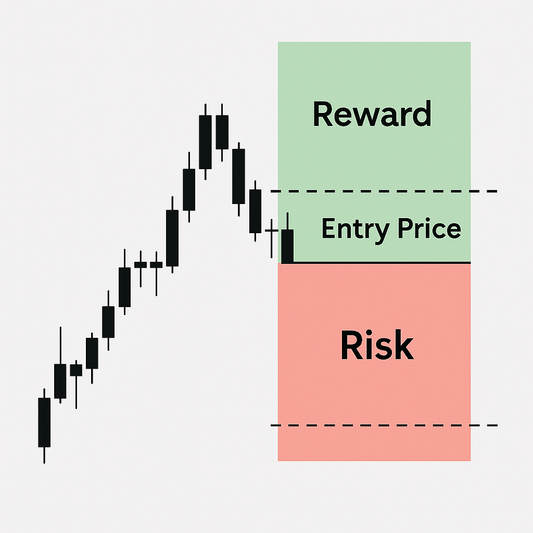
Define entry point after confirmation candle.
-
Place stop-loss below/above pattern formation.
-
Set targets based on previous structure or reward ratio.
Candlesticks vs. Other Chart Types
-
Candlesticks: Show open, high, low, close in one candle.
-
Line Charts: Only show close prices—lacks depth.
-
Bar Charts: Similar to candles, but harder to read visually.
Best Tools for Candlestick Pattern Detection
-
TradingView: Built-in pattern recognition.
-
Thinkorswim: Advanced charting with indicators.
-
MetaTrader: Great for Forex and pattern scripting.
FAQs About Candlestick Patterns
1. Can I trade using only candlestick patterns?
Yes, but results improve when combined with support/resistance and volume.
2. How reliable are reversal patterns?
Reliable when confirmed by trend and volume—but never guaranteed.
3. Do patterns work in all markets?
Yes—stocks, Forex, crypto—but adapt based on volatility and market behavior.
Conclusion and Next Steps
Candlestick patterns are the foundation of price action trading. They offer a window into market psychology and allow traders to react with more clarity. Start by mastering a few basic patterns, observe them in live markets, and build your skills from there.
📘 Master the Trader’s Mindset with “The Trader’s Reflection”
Candlestick patterns tell you what the market is doing—The Trader’s Reflection teaches you how to stay mentally focused when it happens. If you're serious about combining technical knowledge with the right mindset, this book is your next best step.
➡️ Order your copy of The Trader’s Reflection today and take full control of your trading psychology.