What is Price Action Trading? A Practical Guide Without Indicators
Jeffery ObiagwuShare
Introduction to Price Action Trading
Why Some Traders Trade Without Indicators
Price action trading is all about simplicity. Instead of relying on lagging indicators, traders read the story told by price alone—how it moves, where it pauses, and where it reverses.
Benefits of Price Action
-
Clearer charts
-
Real-time decision-making
-
Better understanding of market psychology
-
Fewer distractions and false signals
Understanding Market Structure
Trends, Ranges, and Consolidation
-
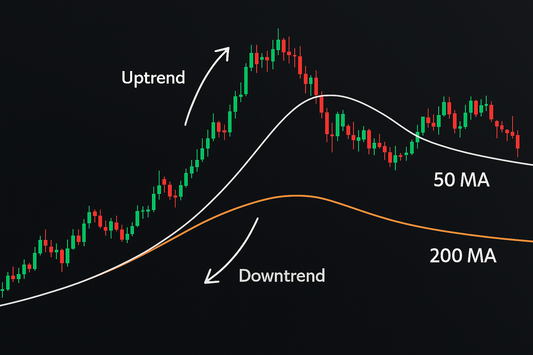
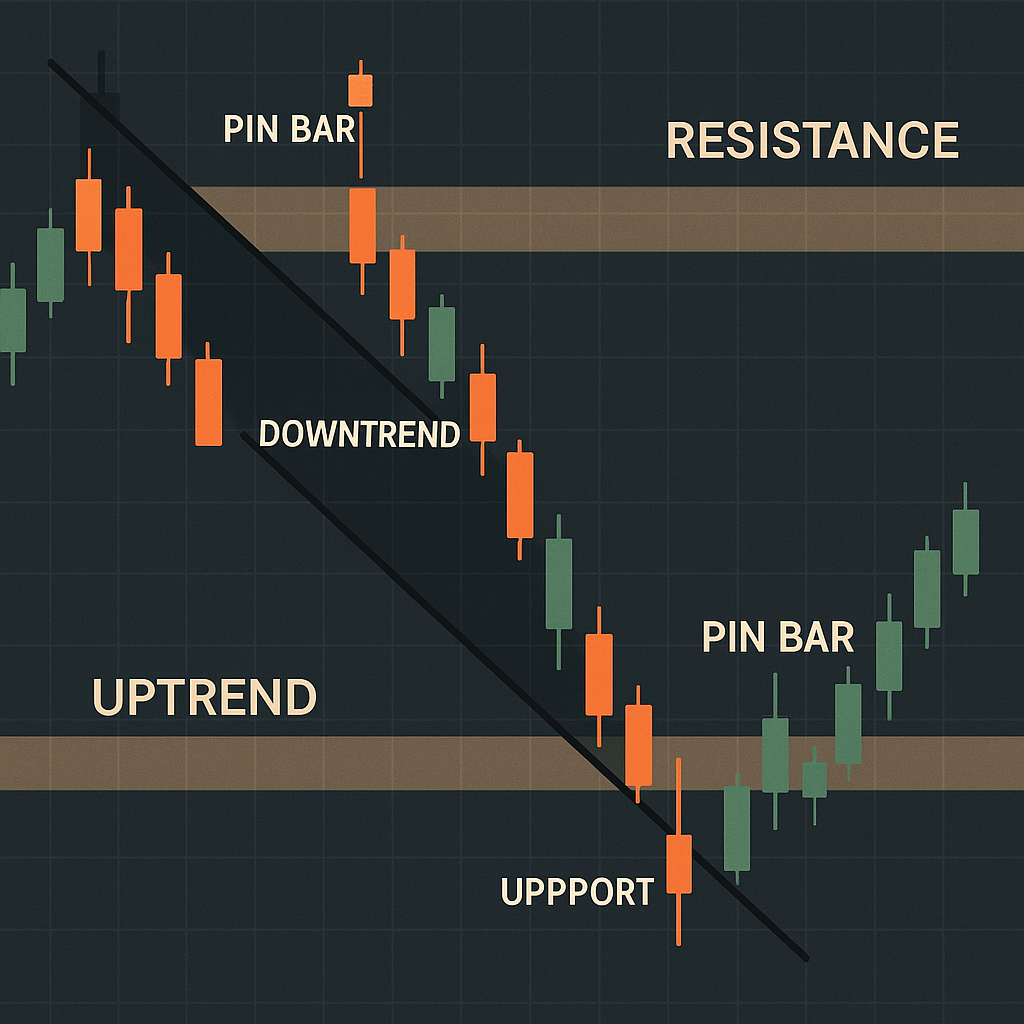
Trending Markets: Higher highs and higher lows (uptrend) or lower highs and lower lows (downtrend)
-
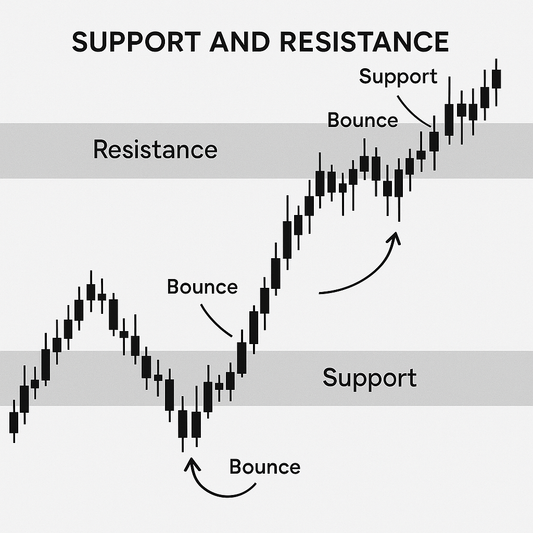
Ranging Markets: Price bounces between support and resistance
-
Consolidation: Tight movement before breakout
Recognizing structure helps you trade with the trend, not against it.
Higher Highs and Lower Lows
This simple concept defines trend direction:
-
Uptrend: Each new high is higher than the last
-
Downtrend: Each new low is lower than the last
Support and Resistance in Price Action
How to Draw Key Levels
Mark areas where price:
-
Repeatedly reverses
-
Consolidates before big moves
-
Leaves strong wicks or gaps
Horizontal vs. Dynamic Support
-
Horizontal Levels: Easy to spot on charts (e.g., 100.00)
-
Dynamic Levels: Trendlines or moving average zones (if used)
Key Price Action Concepts
Supply and Demand Zones
-
Supply: Area where sellers consistently step in
-
Demand: Area where buyers strongly react
These zones are magnets for reversals and breakouts.
Breakouts and Fakeouts
-
Breakout: Price moves beyond resistance/support with momentum
-
Fakeout: Price breaks a level briefly but quickly reverses
Trend Lines
Drawn by connecting swing highs or lows—act as diagonal support or resistance.
Popular Price Action Patterns
Pin Bar
-
Candle with long wick and small body
-
Rejection of price at a level
Inside Bar
-
Smaller candle entirely within the range of the previous one
-
Signals consolidation and potential breakout
Engulfing Bar
-
Large candle that completely covers the previous one
-
Bullish or bearish reversal signal
Fakey Setup
-
False breakout followed by strong reversal
-
Traps emotional traders—great for entries
Using Candlestick Formations Alone
Interpreting Bullish/Bearish Reactions
-
Strong green candles near support = buyers in control
-
Long upper wicks near resistance = selling pressure
Candle Size and Wick Psychology
-
Bigger bodies = strong momentum
-
Long wicks = rejection and uncertainty
Trading Without Indicators: Pros and Cons
Pros
-
Clean charts
-
Immediate insight into market behavior
-
Faster learning of pure market structure
Cons
-
Requires more screen time and experience
-
Risk of forcing patterns that aren’t there
Entry and Exit Strategies in Price Action
Confirmed Breakouts
Wait for a candle close above resistance or below support.
Retest Entries
Enter on a pullback to the broken level with confirmation.
Exit at Next Structure Level
Target previous highs/lows or next supply/demand zone.
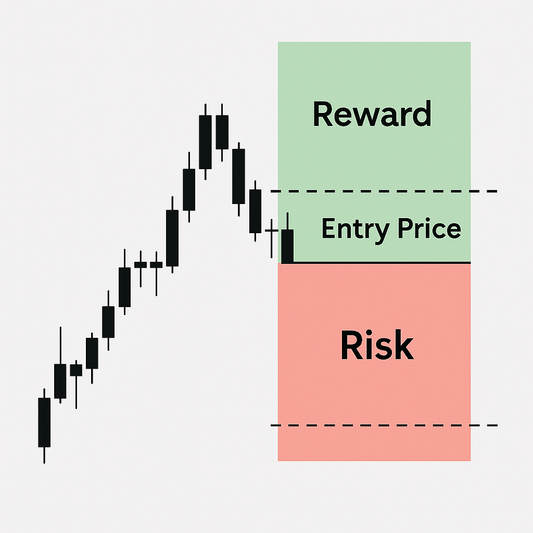
How to Combine Price Action with Risk Management
-
Logical Stop-Losses: Below support for longs, above resistance for shorts
-
Target-to-Risk Ratio: Aim for at least 2:1
Trade setups are only profitable when risk is managed properly.
Using Price Action in Different Markets
Forex
High liquidity makes patterns more reliable.
Stocks
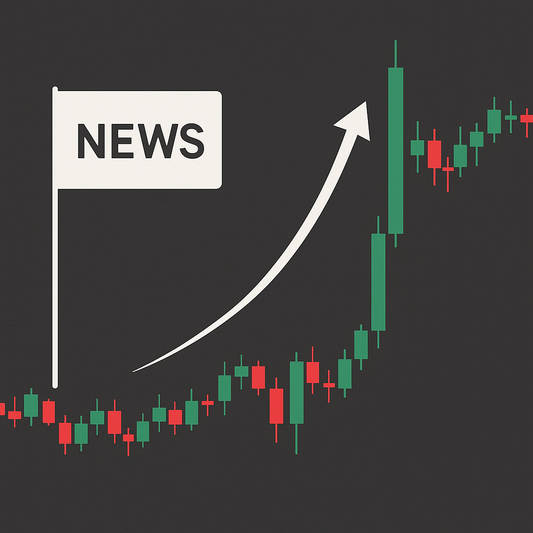
Gaps and news spikes affect candles—adjust expectations.
Crypto
24/7 market leads to unusual candle shapes—watch volume.
Futures
Great for short-term price action traders using tight risk controls.
Common Mistakes in Price Action Trading
-
Overcomplicating Simplicity: Adding indicators defeats the purpose
-
Forcing Patterns: Not every candle has meaning
-
Ignoring Trend Context: Patterns only work when aligned with the bigger picture
Charting Tools for Pure Price Action Traders
-
TradingView: Great for clean, customizable charts
-
MetaTrader 4/5: Forex-focused with price-only templates
-
Thinkorswim: Excellent for stock traders and replay features
FAQs About Price Action Trading
1. Can I be successful using only price action?
Yes—many professional traders do. It’s all about discipline and pattern recognition.
2. How long does it take to master?
Expect 6–12 months of consistent screen time and journaling.
3. Is it suitable for beginners?
Absolutely. It teaches core trading skills and market logic without distractions.
Conclusion and Action Plan
Price action trading offers a clean, focused path to market mastery. By understanding structure, levels, and candle behavior, you’ll gain an edge that many indicator-heavy traders miss. Start by studying one pattern at a time and log every trade for feedback and growth.
📘 Train Your Trading Mind with “The Trader’s Reflection”
Reading price is just one piece of the puzzle—The Trader’s Reflection completes it by sharpening your mindset. Learn how to stay focused, stick to your rules, and trust your setups—even when markets test your nerves.
➡️ Grab your copy of The Trader’s Reflection now and align your psychology with your price action skills.


